
Main window
Central work view with original image, automatically detected analysis image, histogram, and result tables.
Scientific Counter
Flexible software for counting and measuring objects in digital images
Scientific Counter counts and measures objects in digital images: colonies, cells, particles, pores, holes in foams, and other clearly visible structures. This page summarizes typical workflow steps, settings, and result views.
The screenshots are integrated directly into the examples. They show individual windows and explain how each view is used in the analysis workflow.
Central work view with original image, automatically detected analysis image, histogram, and result tables.

Color channel, filters, thresholds, object criteria, and output options are configured here.

Values such as size, brightness, shape factor, Feret diameter, convexity, or solidity can be selected for result display.

Relevant image regions can be restricted, for example for petri dishes, holders, or distracting image edges.

Detected objects are checked by size, brightness, shape, and additional parameters, and filtered if needed.

Distributions of object sizes or other parameters are shown graphically and support evaluation.
The analysis follows a clear workflow: load an image, select color channel and analysis area, preprocess the image, detect objects, separate them if needed, and output results as a table, histogram, or report.
After analysis, the main window shows the original image, analysis image, size distribution, and key result values.
The result view makes distributions visible and supports evaluation of object sizes and other parameters.
Automatic counting of bacterial colonies, for example on petri dishes or in standardized image series.
Detection of separate structures based on size, brightness, shape factor, and additional parameters.
Evaluation of object count, density, porosity, and shape parameters for material-related questions.

Example for measuring individual objects with comparable shape.

Example for size determination of structures in an atomic force microscopy image.
Note: for reliable results, the relevant features should be clearly visible in the image and acquisition conditions should remain as constant as possible within a series.
Analysis tasks differ in contrast, background, object size, and object shape. That is why the key image and object parameters can be adjusted precisely.
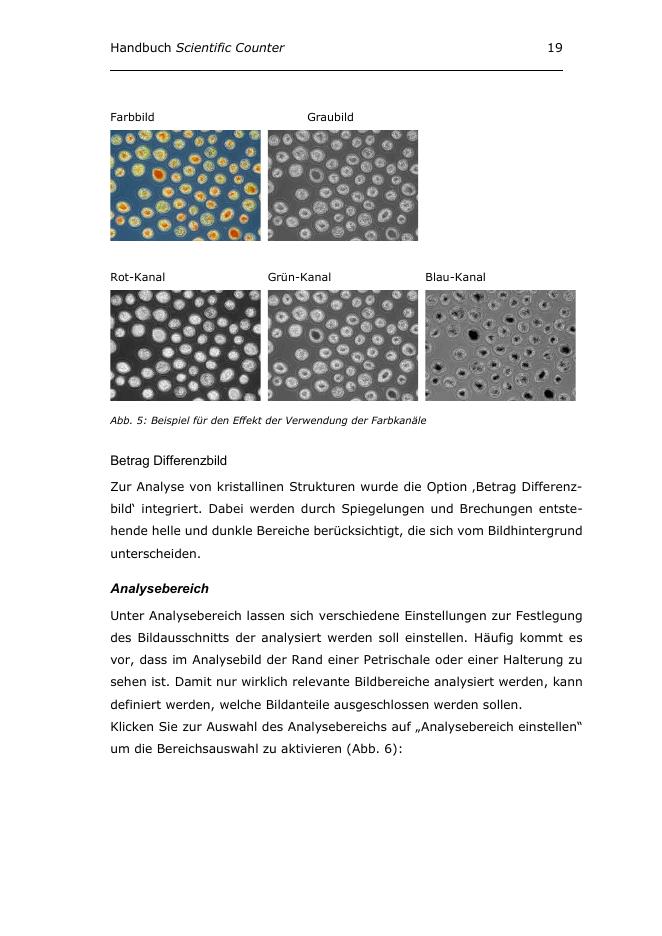
Depending on the image, a red, green, blue, or grayscale image may make the relevant objects more visible.
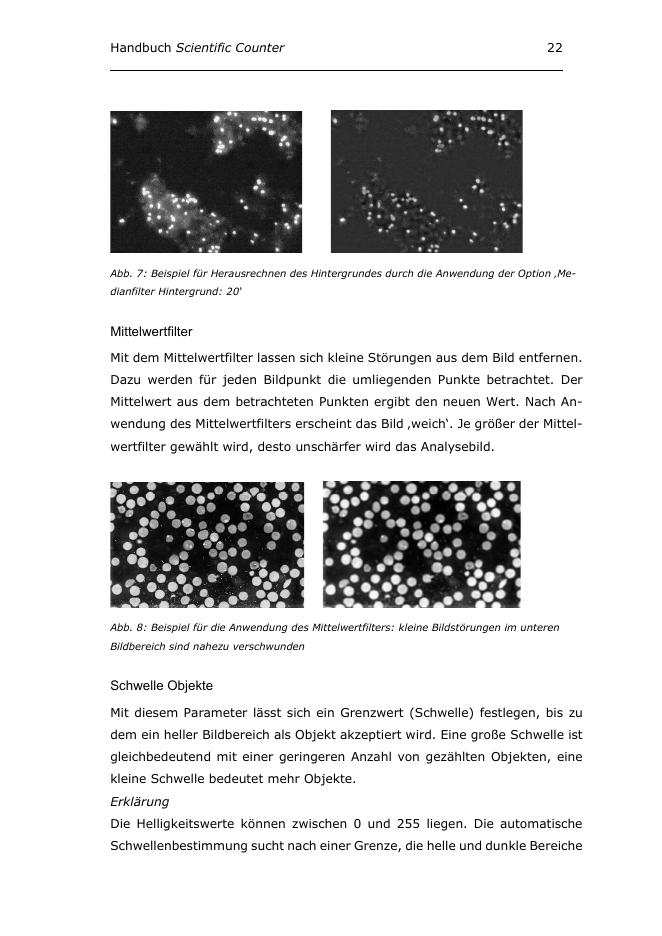
Median and mean filters help with brightness gradients, image noise, and small disturbances.
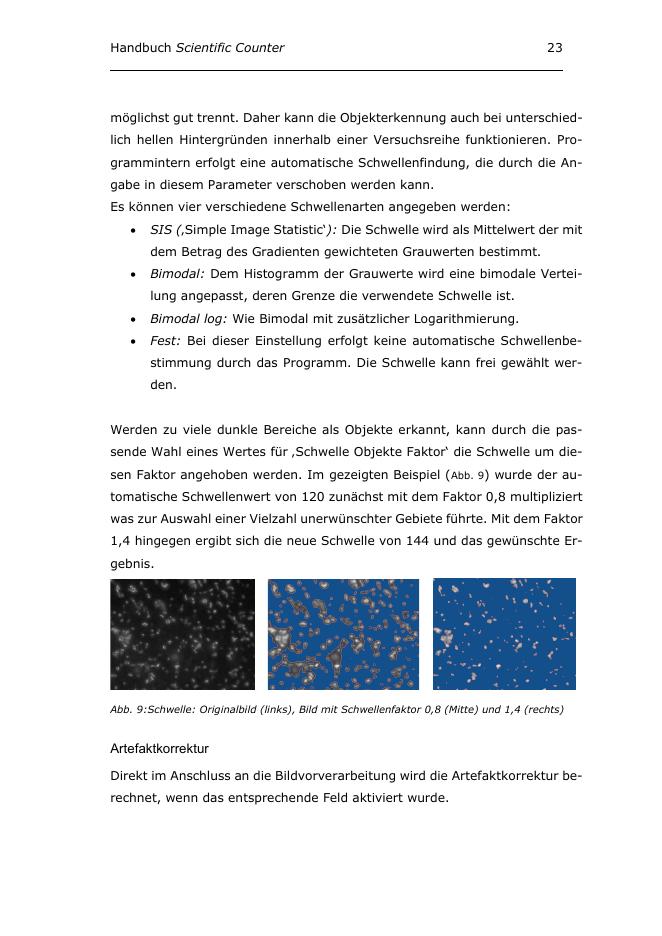
The threshold determines which bright image regions are accepted as objects.
Relevant image regions can be selected specifically, for example to exclude edges or holders.
Detected objects can be checked and evaluated based on size, brightness, and shape factor.
A test area allows quick evaluation of different settings before the entire image is analyzed.